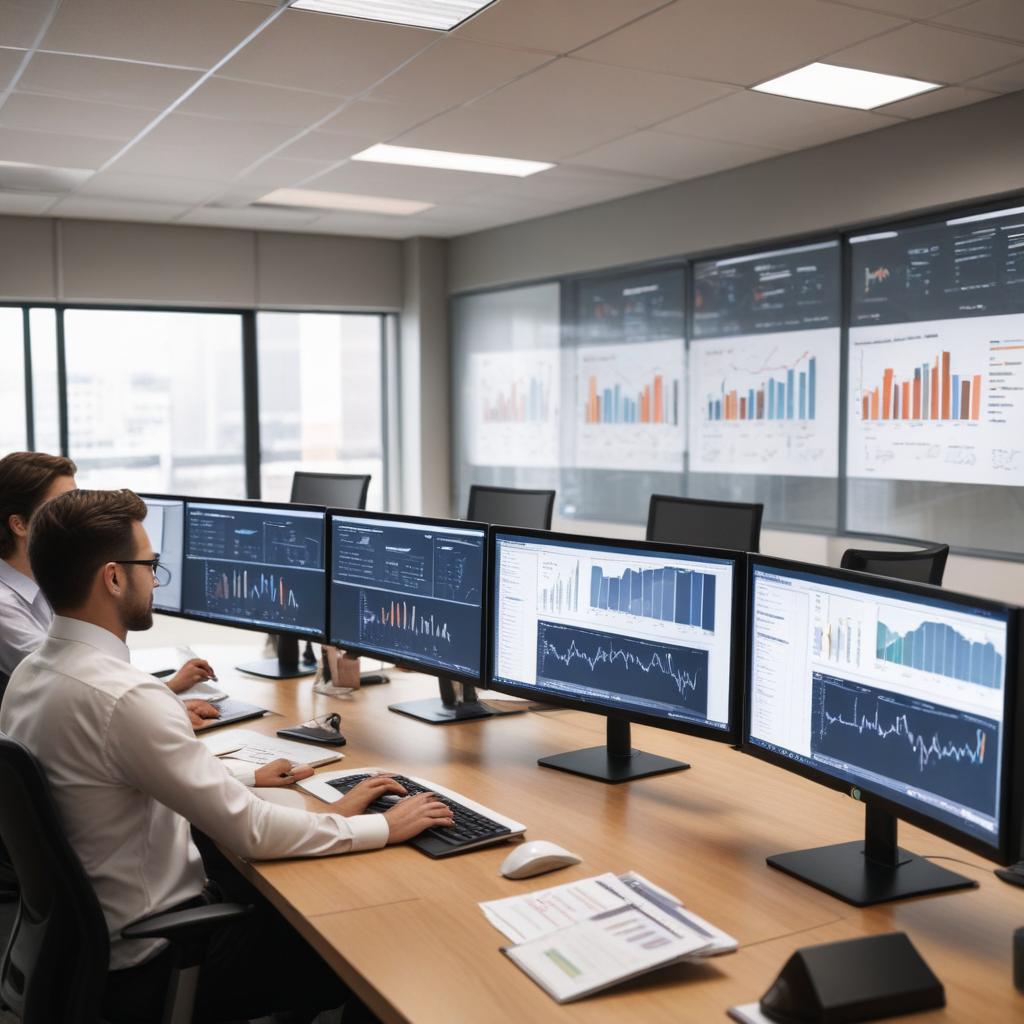
Integrate and Simplify Operations
Optimize Operations
& Maintenance
steady ERP
steady ERP
Explore ERP capabilities that unify business processes, increase efficiency, and support informed decision-making.
Trusted by Leading Companies
Trusted by Leading Companies
Trusted by Leading Companies


ERP Features
Steady ERP is a software system streamlines and integrates all of yours company data into one database system that helps you run the entire business, supporting automation and processes in finance, human resources, supply chain, services, customer relationship management and many more. Including all the features of our steady OMS EXP.
Includes OMS EXP

Sales

Financing

Managers

CRM
+

Human Resources
Metrics & KPIs

Sales
Measures sales efficiency, pipeline performance, order conversions, sales growth, and target achievement.
Sales
Sales
Measures sales efficiency, pipeline performance, order conversions, sales growth, and target achievement.
Sales
Measures sales efficiency, pipeline performance, order conversions, sales growth, and target achievement.
Lead Response Time
Lead Response Time
Lead Response Time
Lead Response Time
Total Pipeline Value
Total Pipeline Value
Total Pipeline Value
Total Pipeline Value
Opportunity-to-Order %
Opportunity-to-Order %
Opportunity-to-Order %
Opportunity-to-Order %
Average Order Value
Average Order Value
Average Order Value
Average Order Value
Average Sales Cycle Time
Average Sales Cycle Time
Average Sales Cycle Time
Average Sales Cycle Time
Sales Volume by Location
Sales Volume by Location
Sales Volume by Location
Sales Volume by Location
Sales Target %
Sales Target %
Sales Target %
Sales Target %
Sales Change (Y/Y, Q/Q, M/M)
Sales Change (Y/Y, Q/Q, M/M)
Sales Change (Y/Y, Q/Q, M/M)
Sales Change (Y/Y, Q/Q, M/M)
Managers
Evaluates managerial performance through customer satisfaction, sales, profitability, and employee productivity.
Managers
Managers
Evaluates managerial performance through customer satisfaction, sales, profitability, and employee productivity.
Managers
Evaluates managerial performance through customer satisfaction, sales, profitability, and employee productivity.
Customer Satisfaction Score
Customer Satisfaction Score
Customer Satisfaction Score
Customer Satisfaction Score
Sales by Product or Service
Sales by Product or Service
Sales by Product or Service
Sales by Product or Service
Revenue per FTE
Revenue per FTE
Revenue per FTE
Revenue per FTE
Revenue per Customer
Revenue per Customer
Revenue per Customer
Revenue per Customer
Operating Margin
Operating Margin
Operating Margin
Operating Margin
Gross Margin
Gross Margin
Gross Margin
Gross Margin
Debt to Equity Ratio
Debt to Equity Ratio
Debt to Equity Ratio
Debt to Equity Ratio
Working Capital
Working Capital
Working Capital
Working Capital
Employee Satisfaction Rating
Employee Satisfaction Rating
Employee Satisfaction Rating
Employee Satisfaction Rating
Human Resources
Monitors workforce health, employee satisfaction, turnover, training efficiency, and hiring practices.
Human Resources
Human Resources
Monitors workforce health, employee satisfaction, turnover, training efficiency, and hiring practices.
Human Resources
Monitors workforce health, employee satisfaction, turnover, training efficiency, and hiring practices.
Absenteeism Rate
Absenteeism Rate
Absenteeism Rate
Absenteeism Rate
Employee Satisfaction Rates
Employee Satisfaction Rates
Employee Satisfaction Rates
Employee Satisfaction Rates
Average Age of Workforce
Average Age of Workforce
Average Age of Workforce
Average Age of Workforce
Training ROI
Training ROI
Training ROI
Training ROI
Labor Cost per FTE
Labor Cost per FTE
Labor Cost per FTE
Labor Cost per FTE
Revenue per FTE
Revenue per FTE
Revenue per FTE
Revenue per FTE
Profit vs. Compensation per FTE
Profit vs. Compensation per FTE
Profit vs. Compensation per FTE
Profit vs. Compensation per FTE
Vacancy Rate
Vacancy Rate
Vacancy Rate
Vacancy Rate
Resignation/Retirement Rate
Resignation/Retirement Rate
Resignation/Retirement Rate
Resignation/Retirement Rate
External Hire Rate
External Hire Rate
External Hire Rate
External Hire Rate
Time-to-Fill
Time-to-Fill
Time-to-Fill
Time-to-Fill
Gender Hire Ratio
Gender Hire Ratio
Gender Hire Ratio
Gender Hire Ratio
Talent Import/Export Ratio
Talent Import/Export Ratio
Talent Import/Export Ratio
Talent Import/Export Ratio
Voluntary Turnover Rate
Voluntary Turnover Rate
Voluntary Turnover Rate
Voluntary Turnover Rate
Retention Rate
Retention Rate
Retention Rate
Retention Rate
Retirement Rate Forecast
Retirement Rate Forecast
Retirement Rate Forecast
Retirement Rate Forecast
Internal vs. External Training Ratio
Internal vs. External Training Ratio
Internal vs. External Training Ratio
Internal vs. External Training Ratio
Average Training Hours per FTE
Average Training Hours per FTE
Average Training Hours per FTE
Average Training Hours per FTE
Average Training Costs per Employee
Average Training Costs per Employee
Average Training Costs per Employee
Average Training Costs per Employee
Financing
Tracks financial health, liquidity, profitability, cash flow, and resource utilization across the company.
Financing
Financing
Tracks financial health, liquidity, profitability, cash flow, and resource utilization across the company.
Financing
Tracks financial health, liquidity, profitability, cash flow, and resource utilization across the company.
Accounts Receivable
Accounts Receivable
Accounts Receivable
Accounts Receivable
Accounts Payable
Accounts Payable
Accounts Payable
Accounts Payable
Total Operating Margin
Total Operating Margin
Total Operating Margin
Total Operating Margin
Gross Profit Margin
Gross Profit Margin
Gross Profit Margin
Gross Profit Margin
Net Profit Margin
Net Profit Margin
Net Profit Margin
Net Profit Margin
Working Capital
Working Capital
Working Capital
Working Capital
Current Ratio
Current Ratio
Current Ratio
Current Ratio
Quick Ratio
Quick Ratio
Quick Ratio
Quick Ratio
Debt-to-Equity Ratio
Debt-to-Equity Ratio
Debt-to-Equity Ratio
Debt-to-Equity Ratio
Inventory Turnover
Inventory Turnover
Inventory Turnover
Inventory Turnover
Total Asset Turnover
Total Asset Turnover
Total Asset Turnover
Total Asset Turnover
Return on Equity
Return on Equity
Return on Equity
Return on Equity
Return on Assets
Return on Assets
Return on Assets
Return on Assets
Operating Cash Flow
Operating Cash Flow
Operating Cash Flow
Operating Cash Flow
Cash Collected vs. Target
Cash Collected vs. Target
Cash Collected vs. Target
Cash Collected vs. Target
Cash Receipt to Bad Debt
Cash Receipt to Bad Debt
Cash Receipt to Bad Debt
Cash Receipt to Bad Debt
Days of Cash on Hand
Days of Cash on Hand
Days of Cash on Hand
Days of Cash on Hand
Fixed Asset Turnover
Fixed Asset Turnover
Fixed Asset Turnover
Fixed Asset Turnover
Long-Term Debt
Long-Term Debt
Long-Term Debt
Long-Term Debt
Total Salary per FTE & Overtime Costs
Total Salary per FTE & Overtime Costs
Total Salary per FTE & Overtime Costs
Total Salary per FTE & Overtime Costs
CRM
Measures customer service efficiency, issue resolution, response times, customer satisfaction, and employee involvement.
CRM
CRM
Measures customer service efficiency, issue resolution, response times, customer satisfaction, and employee involvement.
CRM
Measures customer service efficiency, issue resolution, response times, customer satisfaction, and employee involvement.
Number of Issues (By Type)
Number of Issues (By Type)
Number of Issues (By Type)
Number of Issues (By Type)
First Response Time (FRT)
First Response Time (FRT)
First Response Time (FRT)
First Response Time (FRT)
Average Response Time
Average Response Time
Average Response Time
Average Response Time
Net Promoter Score (NPS)
Net Promoter Score (NPS)
Net Promoter Score (NPS)
Net Promoter Score (NPS)
Employee Engagement
Employee Engagement
Employee Engagement
Employee Engagement

Quality Control
Monitors adherence to quality standards, user errors, and equipment failures.
Quality Control
Quality Control
Monitors adherence to quality standards, user errors, and equipment failures.
Quality Control
Monitors adherence to quality standards, user errors, and equipment failures.
Manage QA Criteria
Manage QA Criteria
Manage QA Criteria
Manage QA Criteria
User Errors
User Errors
User Errors
User Errors
Incidents Related to Equipment
Incidents Related to Equipment
Incidents Related to Equipment
Incidents Related to Equipment
Misused
Misused
Misused
Misused
Missing
Missing
Missing
Missing
DT vs. Throughput (TP)
DT vs. Throughput (TP)
DT vs. Throughput (TP)
DT vs. Throughput (TP)
Due PM Failure
Due PM Failure
Due PM Failure
Due PM Failure
Number of Failures per Equipment
Number of Failures per Equipment
Number of Failures per Equipment
Number of Failures per Equipment

Maintenance
Tracks equipment uptime, preventive maintenance, and maintenance costs versus equipment value.
Maintenance
Maintenance
Tracks equipment uptime, preventive maintenance, and maintenance costs versus equipment value.
Maintenance
Tracks equipment uptime, preventive maintenance, and maintenance costs versus equipment value.
Max, Min, and Average Downtime (DT)
Max, Min, and Average Downtime (DT)
Max, Min, and Average Downtime (DT)
Max, Min, and Average Downtime (DT)
PM Performance Meter
PM Performance Meter
PM Performance Meter
PM Performance Meter
MEL (Maintenance Event Log)
MEL (Maintenance Event Log)
MEL (Maintenance Event Log)
MEL (Maintenance Event Log)
MTBF (Mean Time Between Failures)
MTBF (Mean Time Between Failures)
MTBF (Mean Time Between Failures)
MTBF (Mean Time Between Failures)
Manpower Load
Manpower Load
Manpower Load
Manpower Load
Maintenance vs. Equipment Cost
Maintenance vs. Equipment Cost
Maintenance vs. Equipment Cost
Maintenance vs. Equipment Cost

Projects
Measures project timelines, budget adherence, resource utilization, and customer satisfaction.
Projects
Projects
Measures project timelines, budget adherence, resource utilization, and customer satisfaction.
Projects
Measures project timelines, budget adherence, resource utilization, and customer satisfaction.
On-Time Completion %
On-Time Completion %
On-Time Completion %
On-Time Completion %
Estimate to Project Completion
Estimate to Project Completion
Estimate to Project Completion
Estimate to Project Completion
Planned vs. Actual Hours
Planned vs. Actual Hours
Planned vs. Actual Hours
Planned vs. Actual Hours
Resource Capacity %
Resource Capacity %
Resource Capacity %
Resource Capacity %
Budget Variance (Planned vs Actual)
Budget Variance (Planned vs Actual)
Budget Variance (Planned vs Actual)
Budget Variance (Planned vs Actual)
Net Promoter Score
Net Promoter Score
Net Promoter Score
Net Promoter Score
Number of Errors
Number of Errors
Number of Errors
Number of Errors
Customer Complaints
Customer Complaints
Customer Complaints
Customer Complaints

Priorities and Safety
Prioritizes tasks, tracks risk factors, and ensures operational safety.
Priorities and Safety
Priorities and Safety
Prioritizes tasks, tracks risk factors, and ensures operational safety.
Priorities and Safety
Prioritizes tasks, tracks risk factors, and ensures operational safety.
Class
Class
Class
Class
WOP (Work Order Priority)
WOP (Work Order Priority)
WOP (Work Order Priority)
WOP (Work Order Priority)
Tolerance Period
Tolerance Period
Tolerance Period
Tolerance Period
Risk Factor, Power Load
Risk Factor, Power Load
Risk Factor, Power Load
Risk Factor, Power Load

Operation Management
Monitors contract performance, budget adherence, supply chain efficiency, and risks.
Operation Management
Operation Management
Monitors contract performance, budget adherence, supply chain efficiency, and risks.
Operation Management
Monitors contract performance, budget adherence, supply chain efficiency, and risks.
Operating Contracts
Operating Contracts
Operating Contracts
Operating Contracts
Contracts Budget
Contracts Budget
Contracts Budget
Contracts Budget
Supply Chain, Inventory
Supply Chain, Inventory
Supply Chain, Inventory
Supply Chain, Inventory
High Risk
High Risk
High Risk
High Risk
Sites Dashboard
Sites Dashboard
Sites Dashboard
Sites Dashboard

Purchasing & Procurement
Tracks procurement efficiency, on-time delivery, cost savings, and supplier performance.
Purchasing & Procurement
Purchasing & Procurement
Tracks procurement efficiency, on-time delivery, cost savings, and supplier performance.
Purchasing & Procurement
Tracks procurement efficiency, on-time delivery, cost savings, and supplier performance.
On-Time Delivery
On-Time Delivery
On-Time Delivery
On-Time Delivery
Cycle Time
Cycle Time
Cycle Time
Cycle Time
Purchase Price Variance
Purchase Price Variance
Purchase Price Variance
Purchase Price Variance
Supplier Lead Time
Supplier Lead Time
Supplier Lead Time
Supplier Lead Time
Rejected Items %
Rejected Items %
Rejected Items %
Rejected Items %
Employee Learning
Employee Learning
Employee Learning
Employee Learning
Cost Saving
Cost Saving
Cost Saving
Cost Saving

Operation
Monitors labor utilization, employee turnover, training rates, and support ticket management.
Operation
Operation
Monitors labor utilization, employee turnover, training rates, and support ticket management.
Operation
Monitors labor utilization, employee turnover, training rates, and support ticket management.
Labor Utilization
Labor Utilization
Labor Utilization
Labor Utilization
Employee Turnover Rate
Employee Turnover Rate
Employee Turnover Rate
Employee Turnover Rate
Employee Absence Rate
Employee Absence Rate
Employee Absence Rate
Employee Absence Rate
Employee Training Rate
Employee Training Rate
Employee Training Rate
Employee Training Rate
Total Support Tickets
Total Support Tickets
Total Support Tickets
Total Support Tickets
Open Support Tickets
Open Support Tickets
Open Support Tickets
Open Support Tickets
Ticket Resolution Time
Ticket Resolution Time
Ticket Resolution Time
Ticket Resolution Time
Reopened Tickets
Reopened Tickets
Reopened Tickets
Reopened Tickets
Average Time Between Failures
Average Time Between Failures
Average Time Between Failures
Average Time Between Failures
Average Time to Repair Uptime %
Average Time to Repair Uptime %
Average Time to Repair Uptime %
Average Time to Repair Uptime %

Benchmarking
Compares internal and external performance against industry standards for improvement.
Benchmarking
Benchmarking
Compares internal and external performance against industry standards for improvement.
Benchmarking
Compares internal and external performance against industry standards for improvement.
Black, White, or Grey
Black, White, or Grey
Black, White, or Grey
Black, White, or Grey
Repair, PM
Repair, PM
Repair, PM
Repair, PM
Employee
Employee
Employee
Employee
Service Provider
Service Provider
Service Provider
Service Provider

Cost Management
Tracks asset costs, repair expenses, labor costs, and revenue growth.
Cost Management
Cost Management
Tracks asset costs, repair expenses, labor costs, and revenue growth.
Cost Management
Tracks asset costs, repair expenses, labor costs, and revenue growth.
Asset Cost
Asset Cost
Asset Cost
Asset Cost
Depreciated Value
Depreciated Value
Depreciated Value
Depreciated Value
Manpower
Manpower
Manpower
Manpower
Repair Cost
Repair Cost
Repair Cost
Repair Cost
PM Cost
PM Cost
PM Cost
PM Cost
Parts Consumption
Parts Consumption
Parts Consumption
Parts Consumption
Revenue Growth
Revenue Growth
Revenue Growth
Revenue Growth

Warehouse Management
Optimizes inventory processes, supplier performance, and warehouse utilization.
Warehouse Management
Warehouse Management
Optimizes inventory processes, supplier performance, and warehouse utilization.
Warehouse Management
Optimizes inventory processes, supplier performance, and warehouse utilization.
Inventory Accuracy
Inventory Accuracy
Inventory Accuracy
Inventory Accuracy
Order Cycle Time
Order Cycle Time
Order Cycle Time
Order Cycle Time
Order Picking Accuracy
Order Picking Accuracy
Order Picking Accuracy
Order Picking Accuracy
Rate of Return
Rate of Return
Rate of Return
Rate of Return
Warehouse Capacity Utilization
Warehouse Capacity Utilization
Warehouse Capacity Utilization
Warehouse Capacity Utilization
Stock-Out Rate (Re-order Level)
Stock-Out Rate (Re-order Level)
Stock-Out Rate (Re-order Level)
Stock-Out Rate (Re-order Level)
Number of Suppliers
Number of Suppliers
Number of Suppliers
Number of Suppliers
Supplier Defect Rate
Supplier Defect Rate
Supplier Defect Rate
Supplier Defect Rate
Supplier Quality (Evaluation) Rating
Supplier Quality (Evaluation) Rating
Supplier Quality (Evaluation) Rating
Supplier Quality (Evaluation) Rating
Emergency Purchase Ratio
Emergency Purchase Ratio
Emergency Purchase Ratio
Emergency Purchase Ratio
Inventory Turnover
Inventory Turnover
Inventory Turnover
Inventory Turnover
Inventory Obsolescence (Risk)
Inventory Obsolescence (Risk)
Inventory Obsolescence (Risk)
Inventory Obsolescence (Risk)
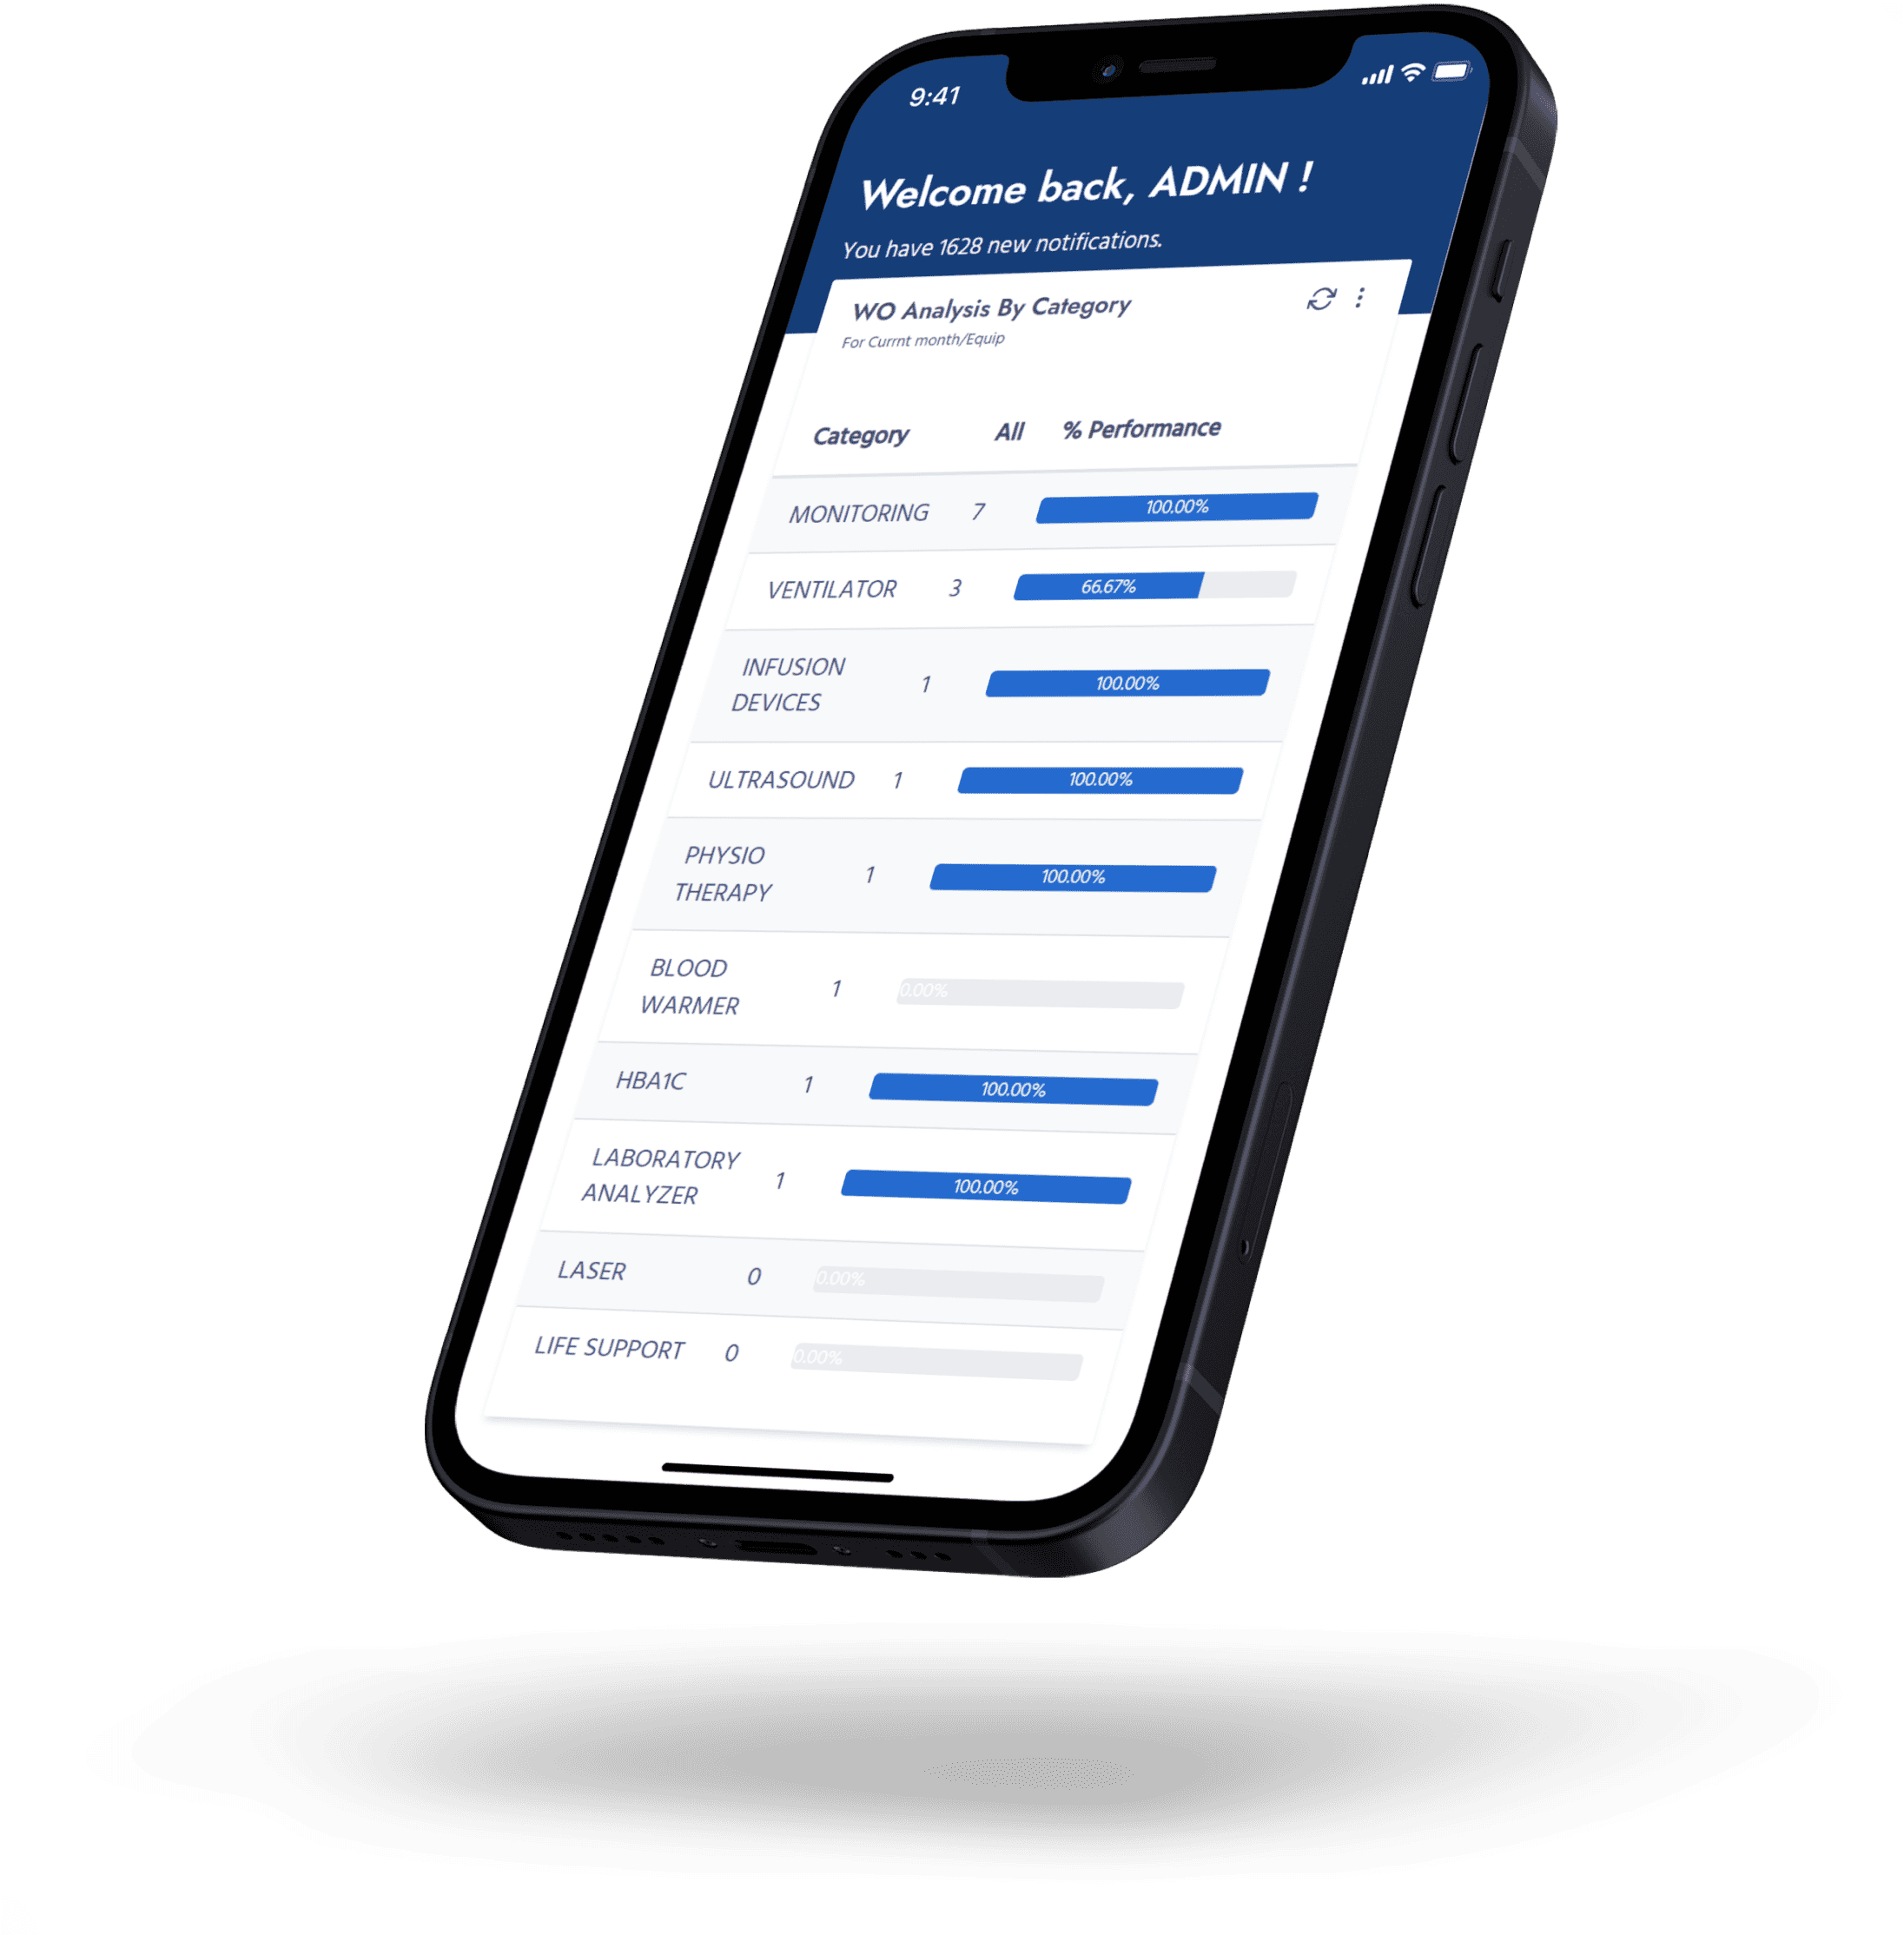
Members Only
Download Our App
Unlock the full potential of Steady Solutions with our mobile app, designed exclusively for registered users. If you're already part of our community, download the app to stay connected, manage operations, and access critical information anytime, anywhere.
Not registered yet? Book a demo & register.

Solutions
Contact
Sat - Thu, 9AM - 6PM GMT+3
Resources
Solutions
Contact
Sat - Thu, 9AM - 6PM GMT+3
Resources
Solutions
Resources
Solutions
Resources